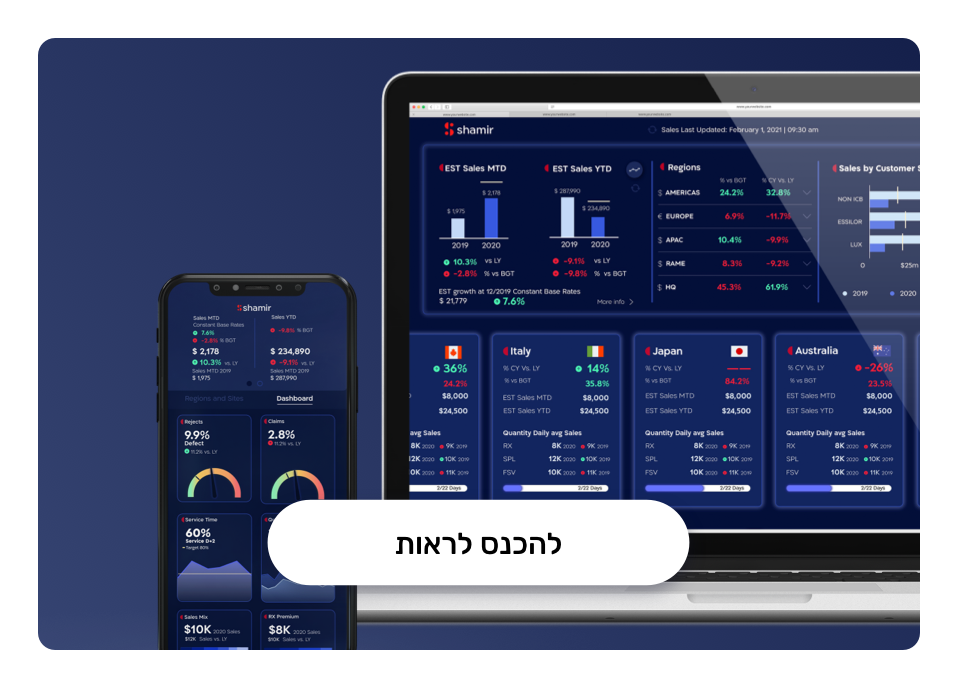
a Global management dashboard uniting measures from different Qlik Sense apps in sales, manufacturing, and operations.
The dashboard is designed to surface daily abnormal readings in the companies measures
The Users
CEO and executives requesting two different analysis types
Desktop – deep analysis from the office environment
Mobile – urgent business queries around the clock form anywhere
The Callenge
6 Different Branches In A Glamps
The challenge resides two parallel planes
designing and specifying the interface – displaying much data on a unified working dashboard and emphasizing critical information
technology – linking together branches from different sources
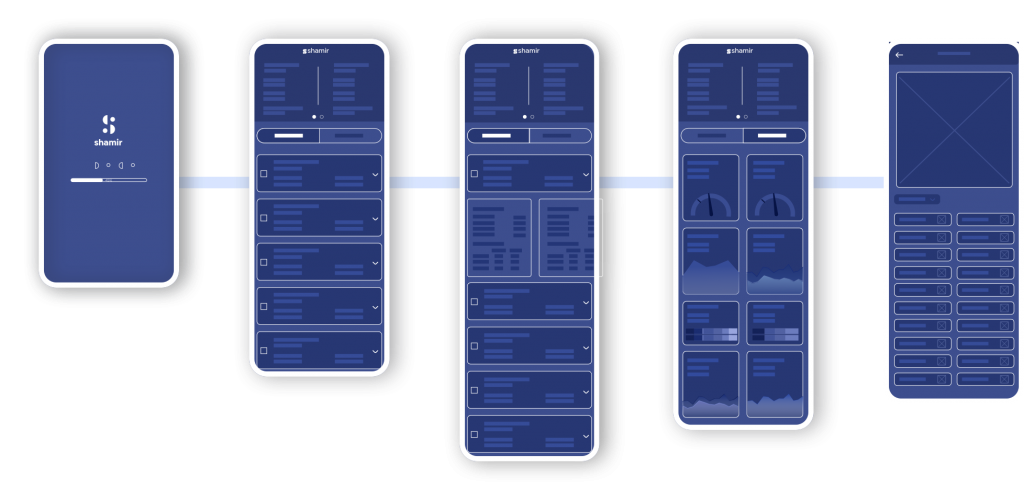
System Development
The technique we used is called Mashup
It basically means mashing together different types of data visualizations on top of Qlik Sense to create a visually flexible and scalable solution
Technologically it allows us to display data from several different branches in a single dashboard
In terms of design it allows us freedom to step out of the BI system, and opens a whole range of design possibilities we know from web and mobile apps .
That freedom lets us dream big.
Mobile Dashboard Design
we’ve specially adapted the content to fit mobile devices, while keeping an emphasis on the difference in screen size and use. more importantly understanding the difference in user needs is key. although the users remain the same, their use of mobile is very different then their use of desktop: the content they need on the move is not the same as in the office.
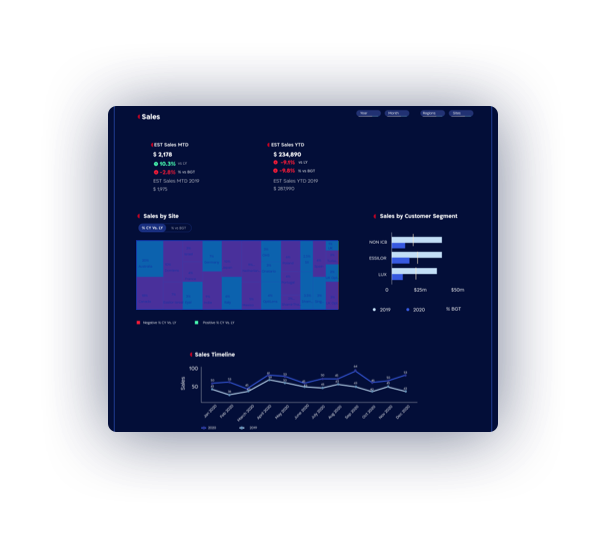
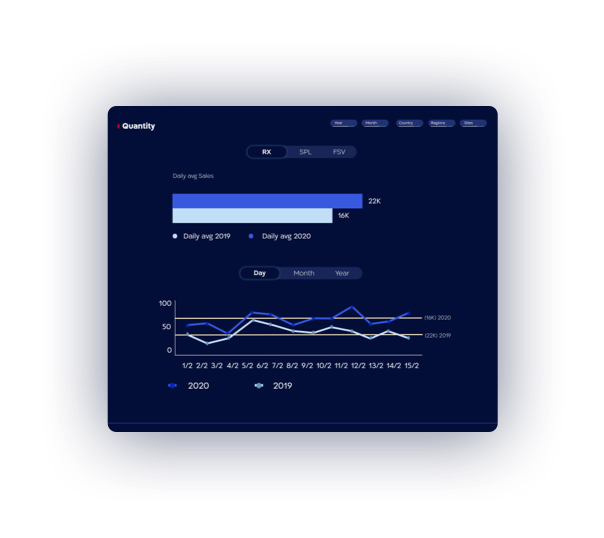
Mobile analysis of the company’s sales branch
Desktop analysis allows for deep and detail data diving.
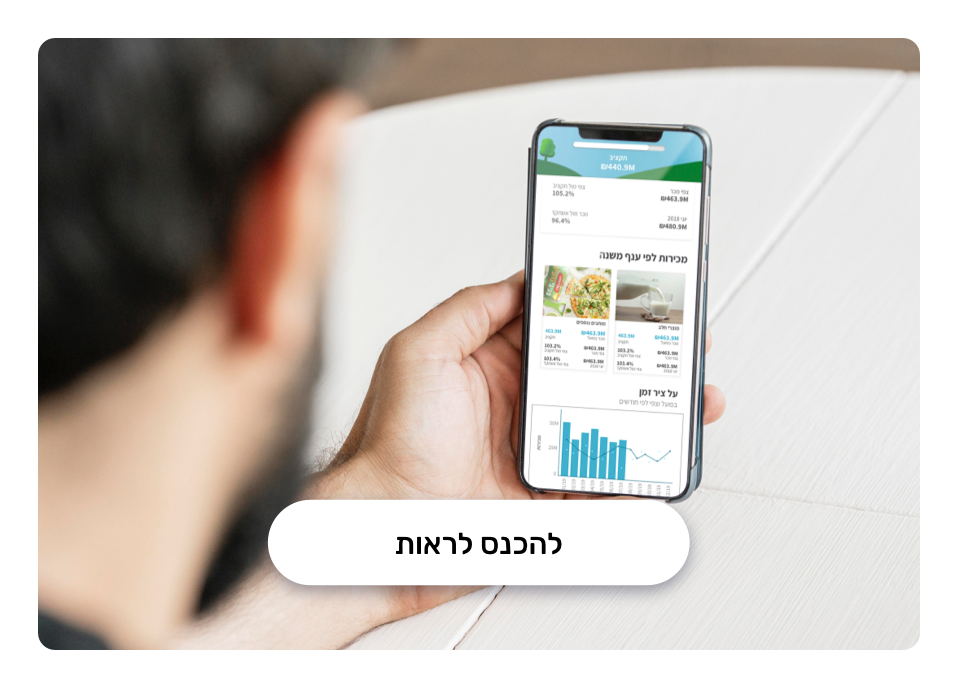
However, in mobile analysis we’ve created the ability to watch current data with a glamps. out of the realization that a mobile user needs fast answers, here, and now.
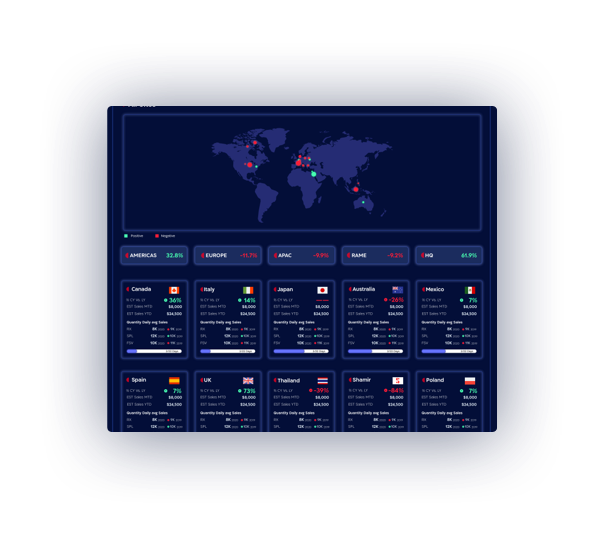
Cards
While in desktop we used a table to display data. it mobile it’s a hassle. with the mashup we’ve developed mobile adapted components that convert the table to a cards gallery